Kitchen Confidential: How my Transit Station Website Really Works
There’s a 1973 quotation from science fiction writer Arthur C. Clarke you have probably heard before: "Any sufficiently advanced technology is indistinguishable from magic." When we encounter technology that operates beyond our current framework of understanding, our experience of it becomes essentially magical - we can observe its effects but cannot comprehend the mechanisms behind them. How many of us truly understand how a touchscreen works? Or even how our glasses lenses interact with our eye to sharpen our vision?
Understanding the principles of corrective lenses might not require too much effort but learning other technologies are harder. Explaining a smartphone requires knowledge of electronics, computer science, materials science, electromagnetic waves, and numerous other fields. This complexity creates a kind of learned helplessness - people give up trying to understand because it seems overwhelming.
Since I started wearing glasses at age four, I’ve been a technology consumer. Now, at mid-life, I am also a technology creator. In addition to taking my marching orders from a computer program, I am now telling a computer what to do. But rather than promote another black box, I’m interested in explaining how my tools work. It helps that my initial products, DMV Transit Tourism and the National Transit Station Gazetteer and Atlas are projects that a hobbyist with some dedicated time and (in my case) a lot of help from generative AI code writing, can accomplish.
But even with a relatively simple product such as the Gazetteer and Atlas there is a lot going on behind the user interface. I’ll walk you through how the website functions using an analogy most of us can relate to: how a restaurant works. Feel free to skim the subject headers and text for an overview or parse the code blocks if you’re interested in the technical details. Bon appetit!
Beginning with the End in Mind
First, let’s take a look at the front end. (Feel free to try it yourself here). A person using my site sees the image below, which includes two drop downs, a “clear search” button, a narrative box, a button to get a narrative, and some brief instructions.

In the image below, a person has selected “Dallas Area Rapid Transit (DART)” from the agency dropdown and the “Convention Center Station” from the station’s dropdown.

Once the website user selects the agency and station and clicks the “Get Narrative” box the text and links appear. The paragraph provides some basic information about the station’s features, location, and transit mode served as well as the neighborhood, nearby points of interest, and links to Wikipedia articles for further reading. Ta da!

It does feel like magic—even for me who wrote the code and created the pathways to make it work (eventually, after multiple attempts). But websites and interactions like this one are a dime a dozen and can be created with free, open-source tools. For the Gazetteer I used python code to handle data processing and database operations, html code to create the structure of my website, and JavaScript to make my website interactive. I included application programming interfaces (API) to link my website to information in other repositories and took advantage of a half dozen software libraries that were developed to perform specific functions. But enough background information. Let’s get cooking.
Setting Up the Kitchen
My platform has a server which I set up using Flask, a web framework for Python that enables developers to build web applications quickly and with minimal boilerplate code. You could think of flask as the platform’s kitchen where raw ingredients are gathered, cooked, and plated before being sent out to the dining room. My first bit of code sets up the kitchen area with various appliances.

The first line `from flask import Flask...` imported the core tools that I will need to build web pages and handle data. The subsequent imports (`pandas`, `os`, `requests`, etc.) brought in additional tools I’ll need such as `pandas` for handling data tables, `requests` for making web requests, `openai` for connecting to OpenAI's services, `geodesic` for calculating distances between locations, `wikipedia` for accessing Wikipedia content, and `BeautifulSoup` for parsing web content. The final part set up logging, which helps me track what is happening in my application, like having a watchful chef that monitors everything going on in the kitchen.
Next, I’ll configure a pathway from the kitchen to the dining room.

This code block set up the basic routing structure for my website. It provides the home page of my website when someone clicks on my site’s URL and will display the map page when a user clicks that page. It also sets up an API to display my transit station dataset.
Choosing the Raw Ingredients
Now it’s time to get out some ingredients. The staple is my dataset of 4,900 transit stations and their features (coordinate points, transit agency names, transit modes served, etc) that I created and discussed in previous posts. Think of the code shown below like a cook going to a pantry and bringing ingredients into the kitchen.

The code loads the data into the website once when the site starts up rather than loading the data every time someone visits my site (which would be slow). It specifies where to find my data (a folder on my hard drive) and performs a few safety checks to make sure the file exists and that it is populated with data. The code also includes logs to keep a record of what happens and whether the data was loaded successfully or something went wrong.
Grocery Shopping
As it happens, we don’t have all of the ingredients we want in our pantry or walk-in freezer and we’ll need to go to the market. In addition to data included in my csv file, I’d like to include information about points of interest (POI) near each transit station. I gathered it using the Open Street Map (OSM) API. I started out by communicating with the OpenStreetMap data repository.

Think of this code as a chef providing grocery shopping instructions to one of their staff. The function identifies three inputs, a latitude, a longitude, and a search radius of 800 meters around the lon/lat coordinate pair. It then builds a query to find three types of places within that radius: "amenity" locations (like restaurants, schools, hospitals), "shop" locations (retail stores), and "tourism" locations (attractions, museums, etc.) It sends this query to the Overpass API (which is like a search engine for OpenStreetMap data). When it gets the results back, it creates a simplified list of places, where each place has: Its name, Its latitude, and Its longitude.
The next code block provides more specific instructions to the grocery shopper: “don’t just go to the store and pick up everything you see in the fruit isle, look through the produce and pick out the ripest and best looking fruits.”

The first code (fetch_pois_from_overpass) casts a wide net. It gets ALL points of interest within 800 meters of a station from OpenStreetMap. This new code (filter_top_pois) takes the big list of POIs from the first function, calculates the exact distance between each POI and the station using geodesic distance, sorts them by distance (closest first), and returns only the the POIs that are closest to the transit station.
This last code block puts it all together:
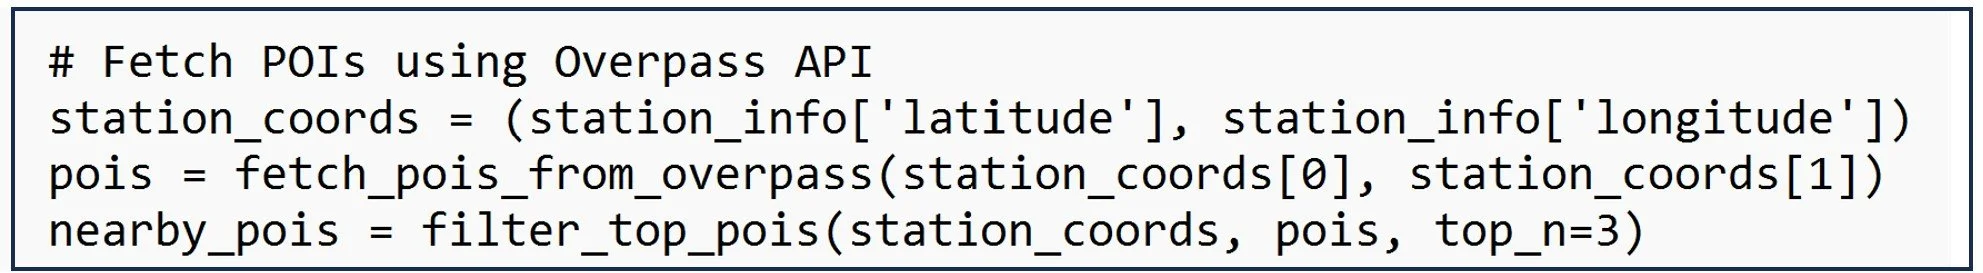
The code creates a coordinate pair for each station in my data set, uses the first function to get all of the relevant POIs within 1/2 mile of the transit station, and then uses the second function to filter them down to the three closest ones.
Now you may be asking yourself, why choose the three closest points of interest near the station? Are these the most important places on the map or the places the website users are most interested in? The answer is: not necessarily. In fact, the code can generate some points of interest that feel trivial such as: “a mailbox” or “a statue” or even the name of the transit station itself. This is a direct result of how OpenStreetMap is crowd-sourced and how different contributors document their local environments. Some contributors are extremely detailed, mapping even very minor features like individual mailboxes, street furniture, or small landmarks while others focus on more major landmarks. There are very few strict rules about what can or cannot be mapped.
But POIs are not the main ingredient. I added OSM points of interest to the paragraph to add local color, to try to communicate a spirit of the place around the transit station. Most of the station area description such as the year the station was built, the square footage, or the lines it serves, can be bland. Think of the POI information as herbs, spices, or garnish.
Mise en Place
This French culinary term refers to organizing all of one’s ingredients and equipment before cooking, having ingredients measured, cut, peeled, sliced, grated, etc and ready to go. My website code arranges the transit station and points of interest data into a paragraph and adds a few words and phrases around each variable, as shown below.

You can think of this code as writing a “Mad Lib” for my station dataset. It creates a template with specific words and a “fill in the blanks” approach for populating data elements such as the station name, facility type, transit agency, transit mode and other features in my data as well as the top three points of interest. The “@app.route” code connects my data file to the template.
Adding Depth
My simple paragraph, shown above, offers some basic facts about each station, and I could probably offer it to my customers as a platter of crudites. But I suspect my diners want more richness and depth than what I’ve prepared so far. For this I turn to Wikipedia, the free online encyclopedia which is written and maintained by a community of volunteers. Many (though not all) stations have Wikipedia articles. There are also articles about transit lines, agencies, and nearby places.
The process for gathering Wikipedia articles is similar to the “grocery shopper” metaphor for POI data. For variation, let’s think about it as working with a research assistant. The first step is to hire the assistant and provide them with some instructions.

This code defines a function that searches Wikipedia and returns relevant article information. The function takes two inputs: 1) A search query and 2) How many results I want (defaulting to three). For each query, it captures the title of the article, a two sentence summary, and the URL link to the article. If it can’t find an article it makes a note and moves on to the next one and if something goes completely wrong, it returns an empty list instead of crashing.
Now that we’ve hired and trained our research assistant, it’s time to ask them to look up information for us.

This code block shows how my application actually uses the Wikipedia search function displayed earlier. First, it creates a search query by combining the station name and agency (e.g., "Union Station Washington Metropolitan Area Transit Authority"). It then calls the search_wikipedia function using this query: wiki_articles = search_wikipedia(wiki_query). The code then references two paths, one called MOCK Response where it skips wikipedia and uses test data (I used this for testing and never re-wrote the code to remove it) and the second, normal operation, where it creates a section for Wikipedia information and, for each Wikipedia article found, adds a title and summary to this section.
At this point, you may ask yourself: “how does the code correctly associate Wikipedia content with a particular agency and station.” The answer is: not particularly well. My current search algorithm looks at text matching between a user’s query and article titles, the frequency and placement of search terms within articles, the number of incoming links to articles, article popularity metrics (how often the page is viewed). Exact matches in titles are given higher priority than matches in article text. While this criteria sounds extensive, it will provide Wikipedia results that are not relevant to the station being queried. A better criteria would add a filter based on the queried transit station’s location to winnow out articles about stations elsewhere in the country. (I’ll include this as an enhancement in the next version).
Cooking
I now have all of my ingredients in place: the station core features from my dataset, the three closest points of interest near each transit station, and Wikipedia articles that relate to the transit station for people interested in further reading. It’s time to put the ingredients on the stove top and create a dish that is greater than the sum of it’s parts. We’ll do this with Artificial Intelligence.

This code shows how I’m using OpenAI's GPT-3.5 model to generate station summaries. First, it creates a prompt template that includes all of the station information from my dataset along with the Wikipedia and POI information. Then it makes a request to OpenAI's API with the model specification (GPT 3.5) defines the AI’s role as a “factual assistant” and setting a temperature of 0.7 (which allows for some creativity in the response while staying fairly focused) and a limit of 200 tokens (keeping responses concise). The result is a paragraph that combines the data elements and information from Wikipedia articles in conversational prose. Instead of butter, eggs, milk, cheese, red peppers and mushrooms, we have an omelet.
As with any cook who is learning the trade, I had to experiment with the AI temperature and instructions before landing on my desired result. Earlier paragraphs about each transit station sounded like they were written by an overcaffeinated realtor pitching the benefits of even the most mundane transit stop. It took a few tries before I prepared something edible.
Designing the Dining Room
I’ve prepared an interesting meal, it’s time to send it out to the diners. But wait, where will my customers eat? I will need to design a dining room. Actually, I will need to design two dining spaces: a large, conventional room and a more narrow and less formal place where people can grab and go. The traditional dining room is a website for desktop computers and the smaller space is a site for mobile devices.
First, let’s gather some materials we’ll need to build our dining room:

This code tells browsers that the the document is an HTML5 document and is in English. The “<meta charset="UTF-8">” ensures proper text encoding and the “<meta name="viewport"...>” makes the page responsive for mobile devices. I also include code to track the number of visitors to my website and display this information in my Google Analytics account. Next I load a few libraries, Leaflet, which will help display a map on this page and PapaPurse, which is used to transform data from my CSV file to information that web browsers can use. These resources are being loaded from external sources rather than being hosted on my server, which helps with performance and maintenance.
The image below shows excerpts from my code that builds out the dimensions of the dining room/webpage, including the dimensions and positioning of the header/navigation bar, the main content area, the map section, and the footer.

This code acts like an architect drawing up a floor plan for a house. I also have code that serves as the interior decorator, providing instructions on the space’s aesthetics. The code shown below formats the page to look good on mobile devices.

You can think of the code for mobile responsive design, map adjustments and very small screens as rearranging your dining room furniture so it fits into a smaller space, but still looks nice.
Preparing a Table and Place Settings
Once we have a dining room, it’s time to prepare a place for people to sit down and order. We start to build it like this:

This code creates the interactive section of my web page, including two drop downs: one that lets a user select a transit agency and a second that lets a user pick a transit station. It also creates a button that allows a user to clear their selection and the button that the user will use to get the narrative description and Wikipedia articles.
Providing the Menu
Now that we have our dining room and our table set up, let’s provide people with a menu. (Conveniently, my restaurant analogy and website terminology overlap as “menu” refers to both a list of food and drink available and drop downs we are used to seeing on our screens). The code block below gets the process started.

The “populateAgencyDropdown” function resets the agency dropdown to start with "Select a Transit Agency.” It takes all the agencies from my data, sorts them alphabetically, creates a new dropdown option for each agency, and adds these options to the agency dropdown menu. The “populateStationDropdown(selectedAgency)” function Resets the station dropdown to start with "Select a Station" and checks if an agency is selected. If there is one, it gets all of the stations for that agency, sorts them alphabetically, creates a new dropdown option for each station, and adds these options to the station dropdown menu.
This creates a dependent relationship between the dropdowns - you have to select an agency before you can see its stations. Think of it has having to order a salad before you can choose a dressing.
Taking Orders
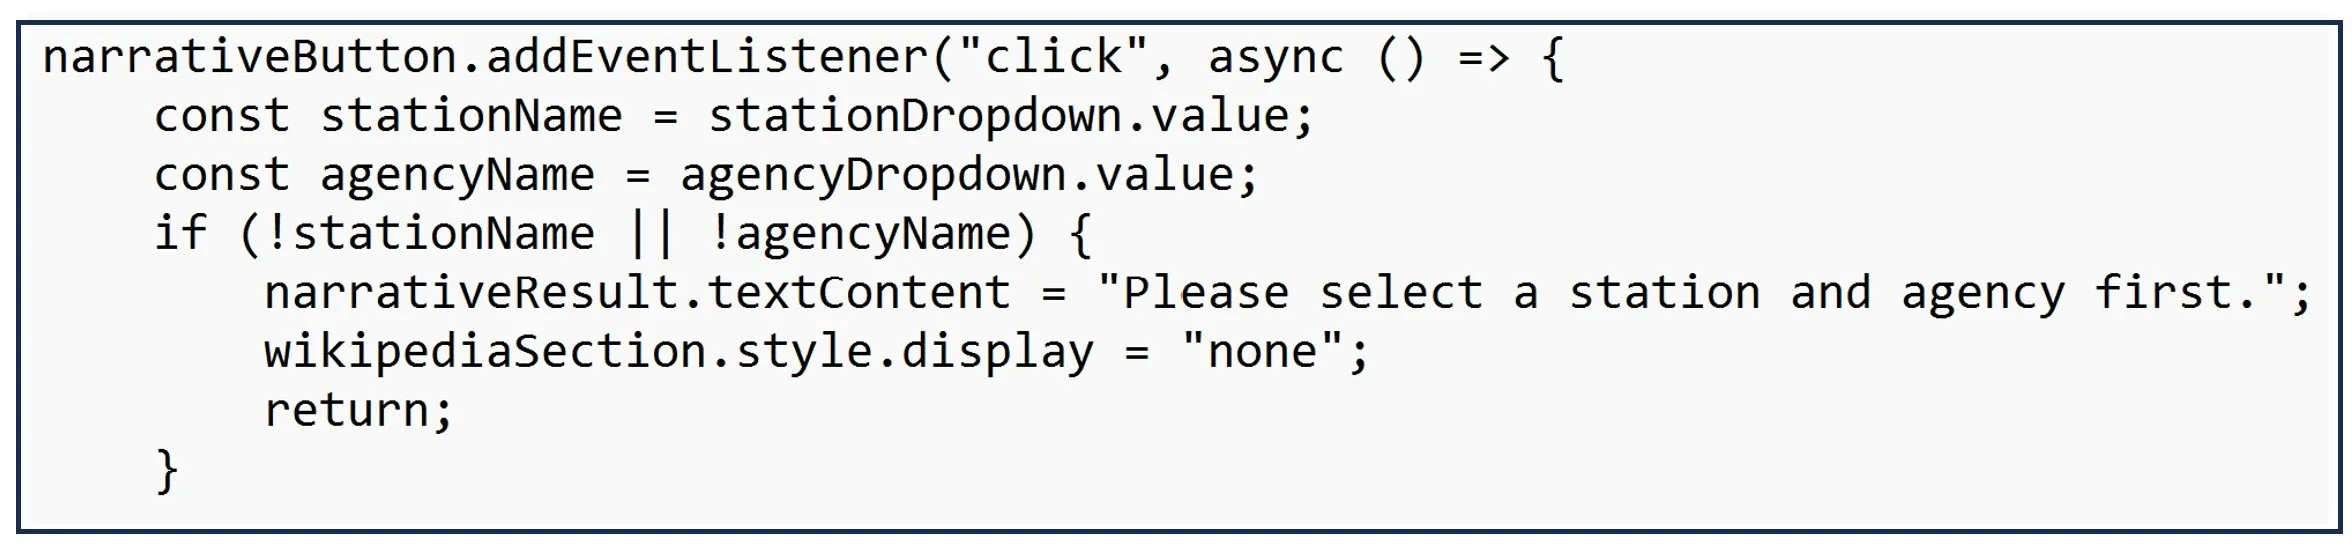
Its time to take orders from customers. This next code block sets up an "EventListener” (i.e. waiter) who appears when the website user clicks a station name and agency name but otherwise waits until they are flagged over. The “const stationName…” and “constagencyName…” capture the customer’s orders. However, there are some rules for ordering. The customer needs to choose both an agency and a station. If they do not choose both, the narrative and Wikipedia information does not display and the process does not continue. Think of this as a waiter giving the customer more time to decide (albeit one who is silently hovering over your table, perhaps making you nervous).
Once the customer has placed an order, the waiter can bring that information back to the kitchen. The code below outlines their next steps:

The “fetch(‘/api/summary/’…” code is similar to the waiter walking to the kitchen. The “POST” tells the kitchen that there is a new order and the “`body: JSON.stringify()” delivers the order in the way that the kitchen staff (the server) can understand. The code: “const data = await response.json()” instructs the waiter to wait for the kitchen to prepare the dish and make it available then check the dish to see what was prepared.
But what if something goes wrong? What if the kitchen is out of an ingredient or the waiter trips and drops the food on the way back to the table? This code block includes a contingency plan. The section beginning with “if (data error)…” stops the process of serving the meal and tells the customer that a problem has occurred. The final code: “});” closes the event handler, like ending the waiter’s shift and making sure everything is wrapped up. The customer then has to start over with a new order, (perhaps served by the same bedraggled waiter or a fresh new member of the staff. I’ll let you and your imagination decide).
Serving the Meal
The code block above also lets the waiter bring the diner’s meal back to their table. These instructions may be hard to spot because most of the code is about how to handle errors, Here is the specific command:

The code provides the waiter with additional instructions for serving up the Wikipedia articles.

This function only shows Wikipedia articles if the code designed to search for articles has identified any that match the agency and station selected. For each article identified, it creates a container with a title, a summary, a “read more” link that opens up a new tab in the web browser and adds this URL to the Wikipedia section of the page.
Cleaning Up
Once a diner has finished their meal and left the restaurant, a staff member clears the plates and resets the table for the next guest. On the website a similar function takes place once the user clicks the “clear screen” button, which clears the summary and Wikipedia articles and re-sets the filters for a new agency and station selection. The code for this process is below:

The "Clear Search" button resets the user interface elements (dropdowns, narrative text, and Wikipedia section) to their initial state by sending a request to the backend to clear the search state and resetting the frontend dropdowns and text content based on the response. Any errors during this process are logged to the console.
Loose Ends
What about paying for the meal and tipping the waiter? Who does the dishes or closes the restaurant at the end of the day? My restaurant analogy goes only so far, though I’m planning a future post to explore the geospatial elements of the site as well as how I made it available to others.
A final thought, for now: writing code, building a website, preparing a meal, or opening a restaurant are all deeply creative acts. Just as a chef's signature dish reflects their unique perspective and experiences, these creations express who we are and how we see the world. As Rick Rubin writes in his book The Creative Act: A Way of Being: "to create is to bring something into existence that wasn't there before. It could be a conversation, a solution to a problem, a note to a friend, the rearrangement of furniture in a room, a new route home to avoid a traffic jam." They are all fundamental aspects of being human.